Displaying search results for ""

How Can Data Visualization Help in the Banking and Finance Sector?

How Can Data Visualization Help in the Banking and Finance Sector?

Real insights come from looking at the world through data and then figuring out how it relates to real insights by talking to customers. Analytics is becoming a competitive necessity for businesses, whether financial services, consumer goods, travel, transportation, or industrial products.

Across all industries, companies that are more analytically driven see three times as much financial growth as their competitors, who are not as analytical. Pharmaceuticals and medical products, insurance, energy, materials, and agriculture are some industries with the most advanced analytics.

But banking, which has been using data for a long time, starts from the best place.

The rising value of insights based on data

In today’s fast-paced business environment, it’s important for finance teams and banking institutions to find data-driven insights and communicate them well. Understanding numbers is still a valuable skill, but it’s also becoming more important to share what the nuances in data mean and why they can be crucial.

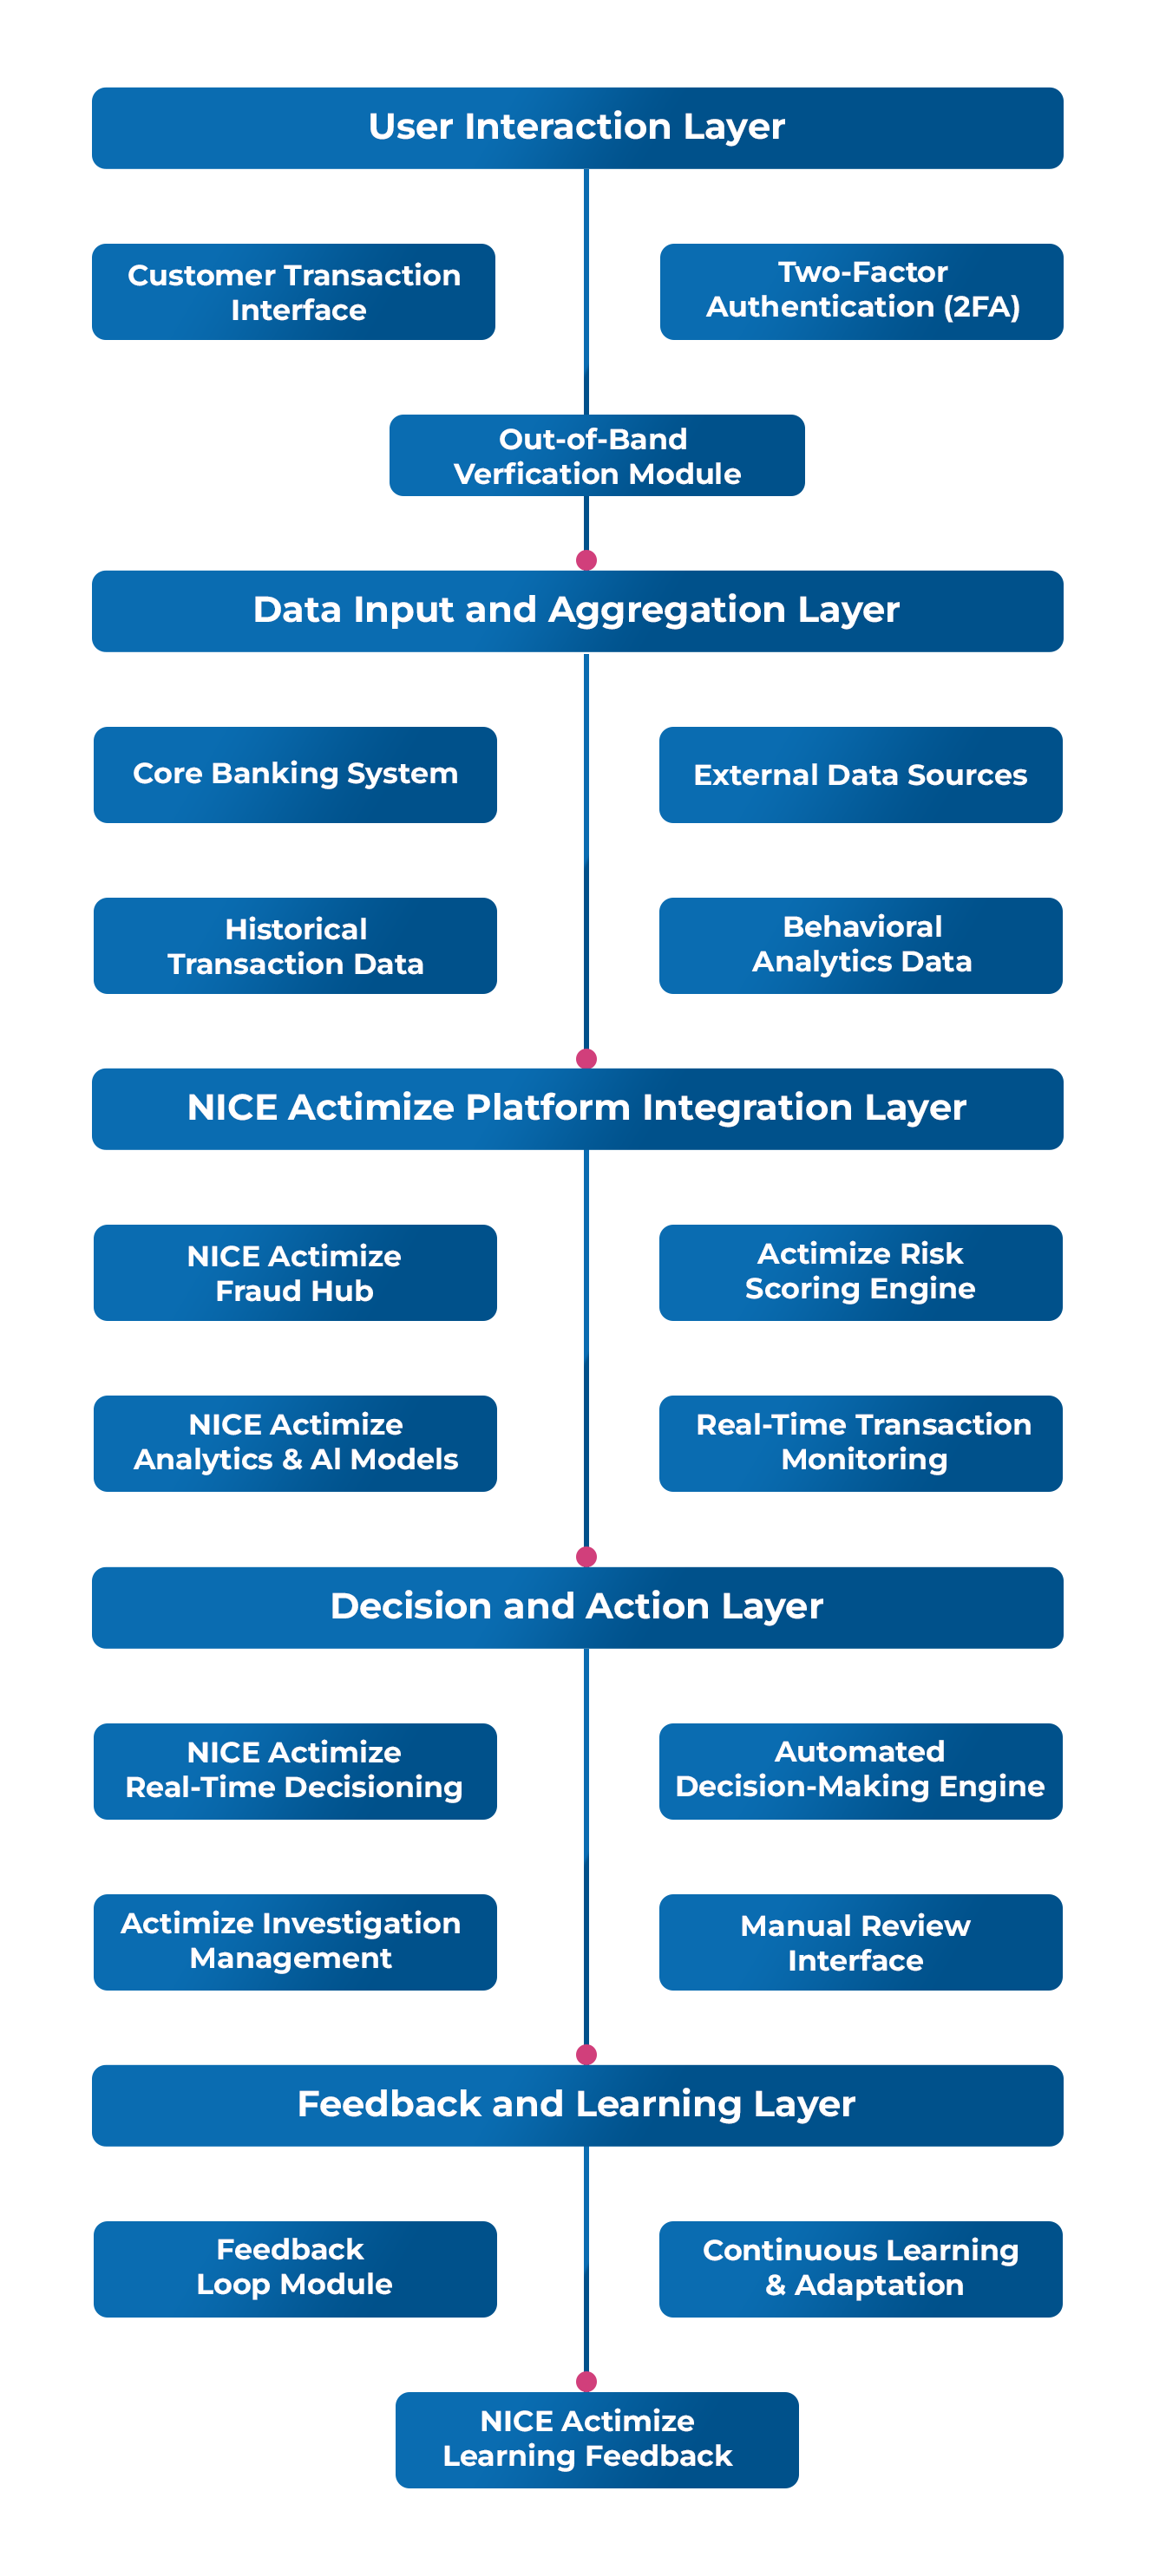
From nice-to-have to must-have: Data visualization in Banking Services.  

Today business performance is turned into insights with the help of automated comments available in data visualizations.

Data visualization equips a command center with a customized alert system.

Data Visualization directs executive attention to the most important areas based on the insights gained. It allows to drill down into critical KPIs and corresponding key focus areas thus identified.

Furthermore, inbuilt tagging in data visualization assists teams in workflow assignments.

Present-Day Challenges in Data Visualization. 

Data visualization is compelling when used correctly because it shows a clear turning point and can make a much stronger case than words or simple data charts. But more often than not, analysts spend about 80% of their time loading data and getting it ready and only 20% of their time making analytics.

This means more time is spent cleaning, reforming, and putting together messy, unrelated data than visualizing and analyzing the results. So, the key is automating as much of the data load as possible to make it easier.

How can banks benefit from Data Visualization?

Analytics is a strategic theme for banks, but most have trouble connecting their high-level analytics strategy to a targeted selection and prioritization of use cases and putting them into action in an organized way. Banks use data visualization in commercial, risk, innovation, and technology areas. It helps align the priorities of analytics with the strategic vision.

Integrating analytics into decision-making and enhancing execution. 

One mandate for data visualization is to build advanced analytics assets and teams so businesses can grow. Most banks have been able to start single, stand-alone projects in advanced analytics that work well, but few have turned them into large-scale, efficient operations. Broader use of visualization reveals transformative opportunities and makes it possible to connect with third-party vendors, which allows competence development.

Investing in crucial analytics roles. 

Banks are hiring more data engineers, data scientists, visualization specialists, and machine-learning engineers to meet the growing demand for people with these technical skills. With the growing importance of data visualization, the need for translators is also increasing. Translators are a vital link between business and analytics. They help data scientists understand business problems and priorities and ensure analytics insights are shared with business units.

Allowing the user revolution to happen. 

Banks have a lot of great data sources that can be used in many different ways, but their data practices tend to be narrow and focused on regulations. So, as data visualization practices permeate, high-quality data is more readily usable to build analytics use cases.

Conclusion

As competition in the financial services industry gets tougher, banks must take a data-driven approach to stay in the game. One important thing to remember when using data visualizations in reports and presentations is that too much detail, no matter how it’s presented, makes it hard for people to understand the main points.

It’s important to remember that these reports and presentations are meant to send clear messages. So, instead of putting a bunch of different graphs in a report, finding the one that best conveys the message and then explaining what it means will be much more effective.

Even if more details are needed, less is often more.


View

5 Best Reasons to Dive into Data Lakes

5 Best Reasons to Dive into Data Lakes

An abiding lesson is here to stay – businesses will always run-on data. After all, companies want to know their customers better and take informed actions at fast speeds that accelerate their growth. However, as data’s volume, velocity, and variety grow exponentially, it is easier said than done.

The challenges of creating and managing data warehouses

For one, there is a matter of time. Cloud-based data lakes are for those situations where businesses need faster and less expensive access to data (instead of creating a warehouse that could take multiple months and millions of dollars). Then there is the matter of cost – of the man-efforts and storage. While the benefits of analyzing data for seeing trends and determining cause-and-effect patterns aren’t lost on businesses, only a few can think of storing 24X7 data for their search queries. Lastly, it is a matter of complexity. Enterprises dedicating teams for prepping and maintaining systems for data analysis is one thing, but provisioning personnel that handles data movement, transformation, allocating schema definitions, and management (for each use case) is another complexity.

Data Warehouses work when –

There are, of course, situations where data warehouses work better. Specificity is one. Data warehouses are the go-to solution when projects are launched with exact questions and intended outcomes. Next is the matter of scale, when hundreds and possibly thousands of users need data access for use cases. Lastly, data warehouses are desirable when the frequency of access is predictable and cyclic.

5 Reasons to dive into a data lake.

Growth in time-series data. 

With the rise of IoT devices, there is an increase in time-series databases. Not only do these engines have specific data models and query languages, but also, they are optimized for certain types of datasets. When such massive sensor data has to be managed, data lakes work out inexpensive compared with the curated data warehouses. However, such a decision should be taken after due diligence and stakeholder alignment, and realistic expectations are served.

Higher business maturity and clarity in use cases.

In the past years (and accelerated after COVID), many industry leaders have realized that their shift toward big data architectures equips them with game-changing capabilities. In the scenarios where they have identified the highest-value use cases for big data, the executives speak about the profound benefits that data lakes bring. There are many benefit areas – real-time risk and fraud alert monitoring and IT performance optimization.

Availability of multiple operating models.  

When selecting the use cases, it is essential to clarify the operating models that best suit data lakes.

The operating model best suited for a data lake is a ‘transformation‘ model when RDBM systems are phased out of customer, product, and business insight-generating functions. Then there is the ‘complement’ model – when a data lake alongside a data warehouse supports use cases that traditional data warehouses don’t fulfill. A ‘replacement’ model is when a data lake replaces parts of the existing data warehouse solution. This step allows for cheaper storage and reduced processing costs. The last operating model is ‘outsourcing’ when companies adopt cloud technologies and reduce their CAPEX for infrastructure and specialist skills. This helps them leverage analytics as a service by having vendors process their data and receive insights in return.

Mainstreaming of data virtualization practices. 

Today the multitude of challenges with data lakes (replicating data, GDPR data security, and data governance) are being solved with data virtualization. Accessing data in place as and when needed rather than moving to another location, organizations are incorporating data virtualization in their data lake implementations. The data virtualization practices integrate data sources across multiple data types and locations, leaving the end-user with a single logical layer. This unifies data governance and security controls, bringing a higher success rate for data lake implementations.

Growth of Industry 4.0

The agile IT architecture needed for Industry 4.0 necessitates using data lakes. As fragmented in-house IT architecture gives way to homogeneity and various connections between data cubes, the importance of data lakes are underscored. More than the pilot projects run today, as the different use cases of Industry 4.0 report higher profitability margins, data lakes with external data integration capabilities would become the go-to standard – for flexibility, security, and higher ecosystem collaborations.

Conclusion 

Data lakes are stepping out of the shadow of data warehouses. New developments and business value are reported increasingly because two powerful shifts have merged – computing power and massive data amounts.

To realize data’s full potential, more businesses will embrace the data lake approaches equipped with robust governance approaches, multi-tiered data usage, management models, and innovative delivery methods.

View

How to Use Data Visualization in Banking?

How to Use Data Visualization in Banking?

More than once, we learn how banks and other financial organizations are asked to get better at “storytelling” by distilling key insights about plans, profits, and prospects, in ways that make sense to non-finance professionals. This ask depends on two things – one is the availability of quality data (metrics, KPIs, and other critical business health parameters), and two, the appropriate tools to access (and represent) both structured and unstructured data culled from across internal and external sources.

The real value of Data Visualization

In this scenario, data visualization unites analytics and data-processing tools to churn out user-friendly reports and bespoke presentations for select audiences. However, the real value for banks is unlocked when a few preliminary questions are used to unravel the core.

  1. Who is the audience, the level of their data expertise, and where would the data be used (precisely, the decision-making it will enable)?
  2. Regarding the device and its designs, interface, and visual experience, what are the data representation requirements?
  3. Finally, what is the outcome desired – enhance holistic decision–making, facilitate deeper conversation, or end-user education?

After discussing the essential goals (audience composition and user purposes) for data visualization, it is natural to look at the various available tools.

Data Visualization Tool Categories 

While the data visualization field evolves at a fast clip, there are three broad categories.

Beginner or DIY Tools

There are products like Tableau and Qlik where the tools are easy to set up, access data from multiple sources, and allow for easy familiarization. Along with extensive product demos, online user communities are associated with powerful tips for getting started, troubleshooting, and advanced features.

Next-Gen Analytics

The next swathe of products comes from IBM, Oracle, SAP, and Microsoft, offering a broader palette of analytics, reporting capabilities, business intelligence, and visualization capabilities. From addressing complex data platform needs to wide-ranging powers, this category asks for more profound expertise from its users.

Open-source tools

Tools like D3.js (D3 stands for ‘data-driven documents’) use a JavaScript library to develop interactive visualizations, So interactive maps within websites (for, say, the election results and other data-driven journalism) are created with such tools. This category works best when extensive customization and large-scale.

To leverage its full potential, these tools require a modest level of JavaScript coding expertise and some proficiency in HTML and other languages. Interactivity is needed. An additional benefit comes when a framework has to be developed, allowing for code to be reused.

Even though data visualization is a way to drive reporting, analytics, and other data representation, it is powerful to tell a story that amplifies the metrics, factors, and variables for both finance and non-finance professionals.

And the outcome? The ability for banks and other finance departments to effectively partner across departments.

Another fertile space for publishing data visualization outputs is social media. After all, for datasets to gain a competitive edge is often closely linked to the number of people that study them and comment on their accuracy and efficacy. Banking teams can often progress beyond pilot projects to command ambitious projects with senior sponsors – thanks to data visualization.  

Beyond the standards – the world of advanced data visualization 

Once the teams master the regular visuals, reports, and dashboards, there is a wide emerging area of ADV where banks can create curated and complex, interactive forms of data visualization. Often web-based, as well as VR, MR, and AR-based, these intuitive visualizations are the future.  

Conclusion – A picture can write a 1,000 words

Helping banks make timely and prescient decisions with mountains of data is at the core of the financial industry. More than ever, there are solutions beyond the traditional BI tools that process and analyze massive data volumes with real-time velocity.

So, be it for risk modeling tasks, meeting regulatory requirements, or operating BAU activities, for banks, data visualization tools have come a long way – from being a nice-to-have to a must-have.

View

5 Important Questions to Ask Before Implementing a Data Lake

5 Important Questions to Ask Before Implementing a Data Lake

The industry drivers (increase in computing power, cloud-storage capacity and usage, and network connectivity) are turning the data deluge into an urgent value proposition for most industries. As the overwhelming information flow (customers’ profiles, sales data, product specifications, process steps, etc) arrives in formats and sources (IoT devices, social media sites, sales systems, and internal- systems), leading companies must establish their ground reality.

What: From general data classification categories (public, internal, confidential) to pinpointing the future use cases (like which AI/ML can exploit data and to what value).

Why: Even before the ‘what,’ the strategic imperative or business growth envisaged from data must be carefully thought through.

Where: Basis the ‘what’ the next level of informed thinking will help teams understand the strategy, architecture, and location of this data.

How: Then comes the mechanics like data identification and tagging, aligning with the organization’s data classification policies, adherence to regulatory requirements, and the daily management activities of data access, correlation, and retention.

Who: This concerns the users, roles, groups, and business units – from establishing the user access protocols and agreeing on the various policies that decide data security, data aggregation, and controls.

When: The last part of the consideration exercise is pertinent to the timing – the readiness needed to design, build, implement and operate a data lake.

While tools such as Microsoft’s Synapse and Purview ease the underlying automation and ETL implementation, data lakes and related data storage and analytics are complex topics.

To begin with, an effective Data Lake is a corporate repository that stores unstructured and structured data, at any scale, on the cloud, on-premises, or hybrid. By implementing such solutions, companies bring in enhanced efficiencies and help identify patterns that unlock new opportunities.

A deeper dive into the ‘what.’

Delving into the “What” at the initial stage throws up exciting possibilities. While corporations working with a range of data across formats (structured, unstructured, semi-structured), it makes sense to implement a data Lake, but if they are working with table-structured information (records included in the CRM or HR systems), more than a data Lake, a data warehouse is a worthwhile investment.

As mentioned above, a deeper dive into the ‘why’ is a must. In this, the implementation roadmap of the data lake must establish the plan to leverage the data (process maps for data analysis, organization, and categorization)   

Gauging the Implementation difficulty for Data Lakes. 

While bringing new sources into a data lake is effort-intensive, inaccurate planning of continuous data acquisition will lead to serious ETL overhead. Additionally, the data lake processes must be measured for their cost and time trade-offs. If the resource requirements are prohibitive, companies must assess the data warehouse option – something that allows them to store data with minimum cost and then extract and transform the data as and when needed.

 Incorporating into the company’s culture. 

A vital component of data lake implementation is the smooth transition – from training employees in advance, stage-wise reduction of workloads, being open to learning new skills, embracing a flexible mindset, and inter-departmental cooperation. The nuances are unique as each company culture responds differently to data lake implementation initiatives.

Along with the 5W and 1H checklist of data lake implementation, leading CDOs, CIOs, and CXOs are also aware of the stages a company has to go through while building and integrating data lakes into their tech architectures. Here are four steps described broadly.

  1. Stage 1 – Landing/Drop zone (creating data lake separate from core IT systems. Stored in raw format, internal data is complemented or enriched by external data sources.
  2. Stage 2 – Learn Fast (data scientists analyze data lake to build prototypes for analytics programs)
  3. Stage 3 – Sharing loads (integrating with internal enterprise data warehouses – EDW. More detailed data sets are pushed into the data lake for assessing storage and cost constraints).
  4. Stage 4 – Forming a part of the core (data lake replaces operational data stores and businesses graduate to data-intensive applications like ML processing. Strong data governance protocols are put in).

Conclusion

In our times of data deluge, as more companies experiment with data lakes, the questions of – harvesting advantages in information streams and storage costs are essential. Like any new technology deployment, a total revamp of existing systems, processes, and governance models is necessary. An agile planning approach is sure to bring an inevitable readiness regarding business capabilities, security protocols, talent pools, and integration with an enterprise’s existing architecture.


View

Data Lake vs. Data Warehouse: The Better Choice

Data Lake vs. Data Warehouse: The Better Choice

Getting big impact from big data needs radical customization, continual experimentation, and new-age business models. In a world where data is widely available, what brings the edge? Going a step further, with widespread real-time personalization now a real possibility – how do companies see the same data differently to unearth new value?

Planning for Big Data – Today’s need

Answering these questions starts by parsing the three elements of a ‘Big Data Plan’: Data, analytic models, and tools. Along with the data scientists, these three things point to where the most significant returns are to be found, where the crucial decision-points and trade-offs are, and most importantly, the vital conversations that data leaders – CIO, CXO, CDO, and the like – must continually have.

It is essential to discuss the first component – Data (unstructured or structured) – assembling and integrating it. After all, critical information could lie anywhere – buried deep inside a company’s horizontal or vertical silos or be outside in social-network conversations. Creating ‘meaning’ out of this information for long-term gains requires significant investments. Either investing in new data capabilities or a massive reorganization of data architectures or sifting through tangled repositories and implementing data-governance standards that maintain accuracy. But everything begins with ‘storage.’

The Two Defined. 

Data Lake and Data warehouse both store Big data. Before we get into the ‘what’s better’ debate, let’s go by their definitions.

Data Lake pools data (current and historical) from one or more systems in its raw form, allowing analysts and data scientists to analyze the data quickly. A Data Warehouse, by contrast, does the same thing, except it stores current or historical data in a pre-defined and fixed schema.

Both – Data Lake and Data Warehouses – are used for analytical purposes and depend on ETL frequency for their data freshness.

The Two Characteristics. 

A Data Lake stores relational data from LOB applications and non-relational data from mobile apps, IoT devices, and social media. As the data structure (or schema) is undefined when captured, the user can store without careful design or the need-to-know what questions will need future answers. The Data Lakes use cases include analytics like SQL queries, big data analytics, full-text search, real-time analytics, and machine learning.

A Data Warehouse analyzes relational data coming from transactional systems and line of business applications. The structure and schema are pre-defined to optimize for fast SQL queries, and the results are typically used for operational reporting and analysis. Moreover, as it is cleaned, enriched, and transformed, data from a warehouse often acts as the “single source of truth.”

Different Approaches. 

Today more organizations with data warehouses are spotting value in data lakes and are expanding their warehouse to include data lakes. This is helping them unlock diverse query capabilities and new use cases and discover new information models.

Significant differences

While the primary difference is about the schema (Data Lake is schema-on-read and Data Warehouse is schema-on-write), there are more distinctions.

Data warehouse returns faster query results but has a higher cost/storage ratio. In Data lakes, the query results are getting faster by the day, given the dropping cost of data storage.

Furthermore, Data lake is usable for most data scientists and developers; Data Warehouse finds higher preference with business analysts.

Lastly, the key difference from a use-case point of view is that Data Lakes are conducive for Machine learning algorithms, predictive analytics, data discovery, and profiling, whereas Data Warehouse is used more for batch reporting, BI and visualizations.

Conclusion

Building a customized data system that pieces a company’s unique big picture is essential in the age of big data. With hyper-competition and growing consumer awareness, companies face never-before churn levels. Looking at the data with a segmented eye is not adequate for customer retention or improving loyalty. Bringing operational, survey, and social feed data together by creating a single source of truth can be a game-changer.

Storing, cleaning, analyzing, and sharing data and supporting the AI and ML processes that feed on this data offer long-term growth.

View